
The complete foundation-repair platform
Analyze what others can't.
From inspection to final invoice.
All in one platform.
Meteora IQ does the deflection and tilt analysis generic takeoff tools can't — and everything that comes next: reports, repair plans, takeoffs, estimates, e-signature, and invoicing — then scheduling, crew dispatch, and job costing.
Start with elevation analysis, contours, and 3D — then design the repair, price it, present it, get paid, schedule the crew, and track the profit — all without switching tools.
- WORKFLOW
- SURVEY → PROFIT
- ANALYSIS
- L/240–720
- TAKEOFF
- AUTOMATIC
- TURNAROUND
- MINUTES
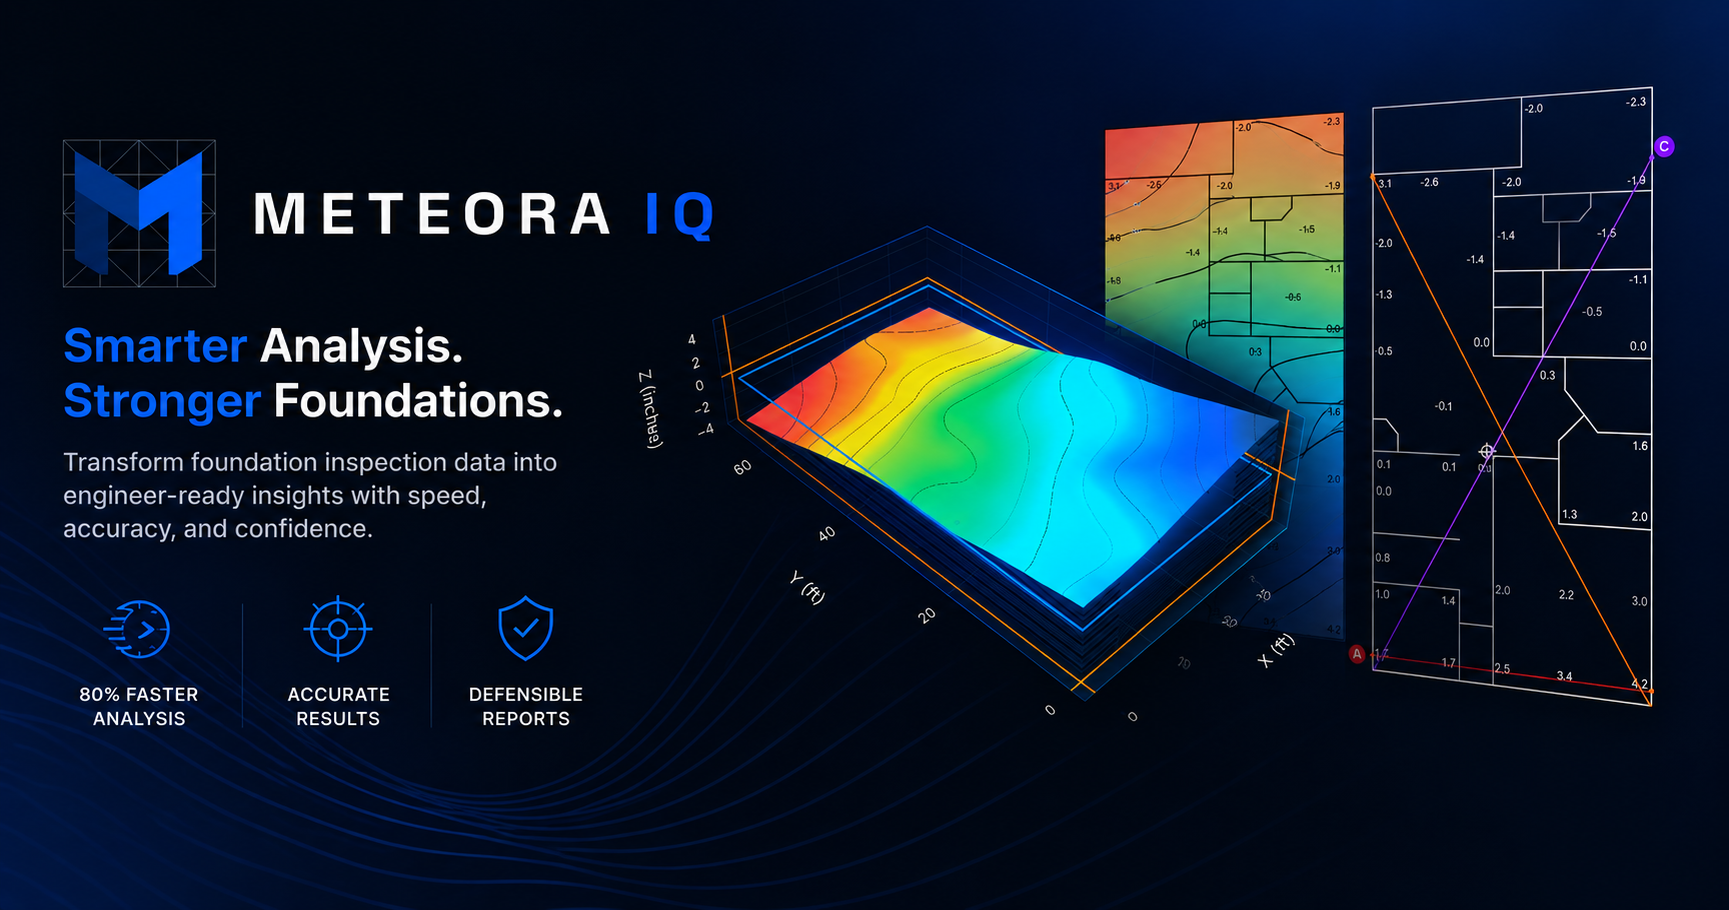
THE OUTCOME
Less time. Every number traceable.
- 80%+FASTER
- Less time from survey to finished report than manual deflection and tilt work.
- ZEROHUMAN ERROR
- Transcription and calculation run end-to-end in software — the math never passes through a person's hands.
- 100%TRACEABLE
- Every number on the report links back to a real reading on the plan. Nothing is a black box.
THE WORKFLOW
One workflow, from the first survey to the finished job.
- 01
Schedule & route the day
Put inspections and repairs on a shared calendar and auto-optimize each route with live Google drive times.
- 02
Build or upload the sitemap
Draw the foundation and drop in your readings, or upload a sitemap PDF or image from any survey tool — OCR reads every elevation on the plan.
- 03
Run the analysis
Deflection, tilt, contours, elevation transposition, and 3D terrain — in seconds.
- 04
Deliver the report
Compile a branded, defensible PDF your client or adjuster can act on.
- 05
Design the repair & take off
Lay out the repair plan on the drawing — piers, beams, and quantities take off automatically.
- 06
Estimate & present
Price it from your book, present a branded proposal, and capture the customer's e-signature.
- 07
Invoice & get paid
Send the invoice and collect payment — without leaving Meteora IQ.
- 08
Dispatch the crew
Assign crews to jobs and dates from one board, so every field lead sees exactly where to be.
- 09
Track cost & margin
Cost carries over from the sold estimate, so you watch it against revenue and know the profit on every job.
ONE PLATFORM · ANY SOURCE
Works with the survey data you already have
Meteora reads the plan, not a proprietary file — so it doesn't matter what you measured with. Bring a sitemap PDF or image from any source, or build one in the Sitemap Builder. OCR pulls the readings off the page, you confirm the boundary and scale, and the full evaluation runs in one place — no re-keying numbers between tools.
Measurement, mapping, deflection and tilt, 3D terrain, and a branded report — the entire foundation evaluation, end to end, on a single platform.
- Sitemap PDF
- Photo or scan
- Laser / optical level
- Total station
- CAD export
- Hand sketch
THE MODULES
From survey to signed proposal.
Everything from measurement and analysis to repair design, estimating, and getting paid — in a single platform.
SITEMAP BUILDER
No drawing? Build one in the browser.
Don't have a CAD file? Draw the foundation footprint to scale, drop in your elevation readings, and place reference points — right in the browser. The sitemap you build feeds every module: contours, deflection and tilt, and the 3D model. No external drafting tool required.
- Draw the slab outline to scale
- Place readings, datums, and notes
- Feeds contour, deflection, tilt & 3D directly
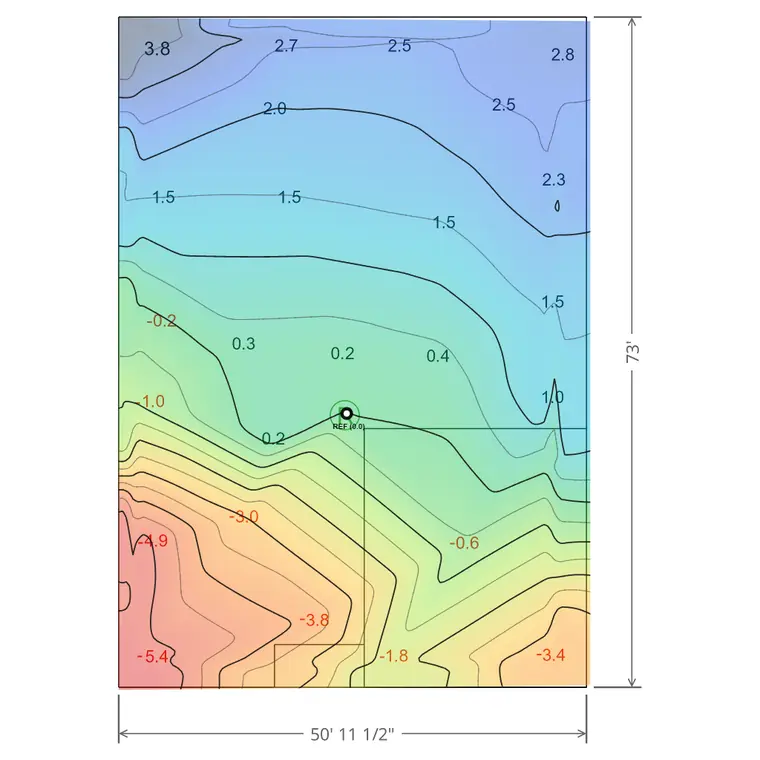
AUTOCONTOUR
Elevation, made legible
Every reading becomes a smoothed contour map with a full elevation ramp — high ground to low, labeled and to scale. The output your client actually understands.
- Labeled contour intervals
- Heatmap fill with elevation ramp
- Scaled plan dimensions
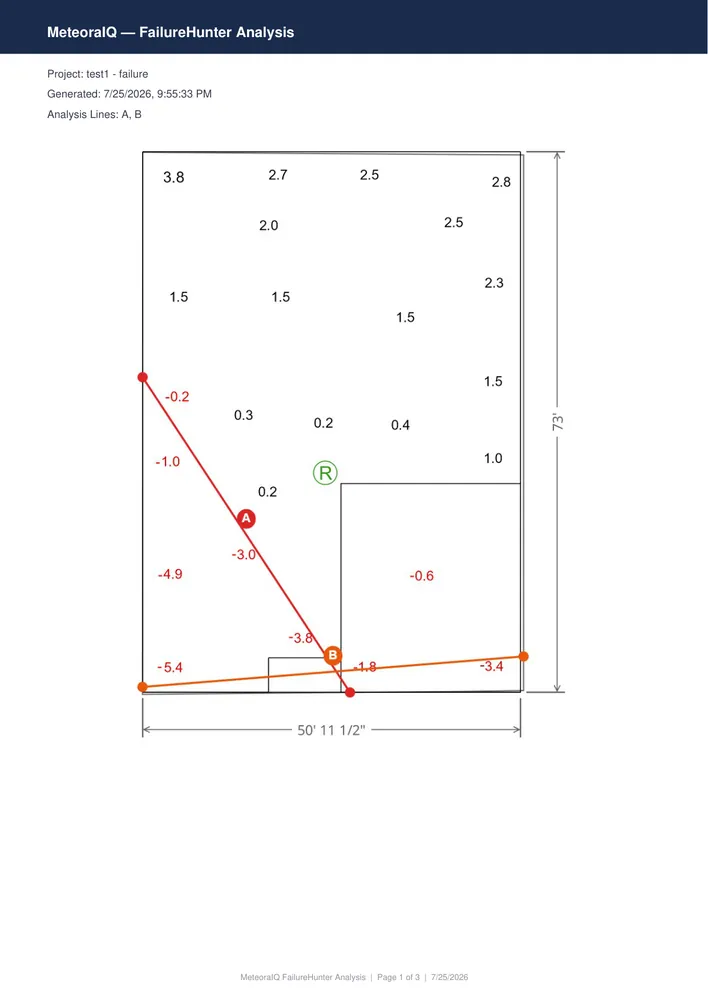
AUTOMATED DEFLECTION & TILT ANALYSIS
It finds the failures for you
Automated Deflection & Tilt Analysis sweeps the foundation for the worst deflection and tilt paths, then reports each one against your selected deflection threshold (L/240-L/720) and the 1% tilt limit — with the profile behind every verdict.
- Worst-case line detection
- Multi-threshold L/240-720 + tilt
- Profile plot per line
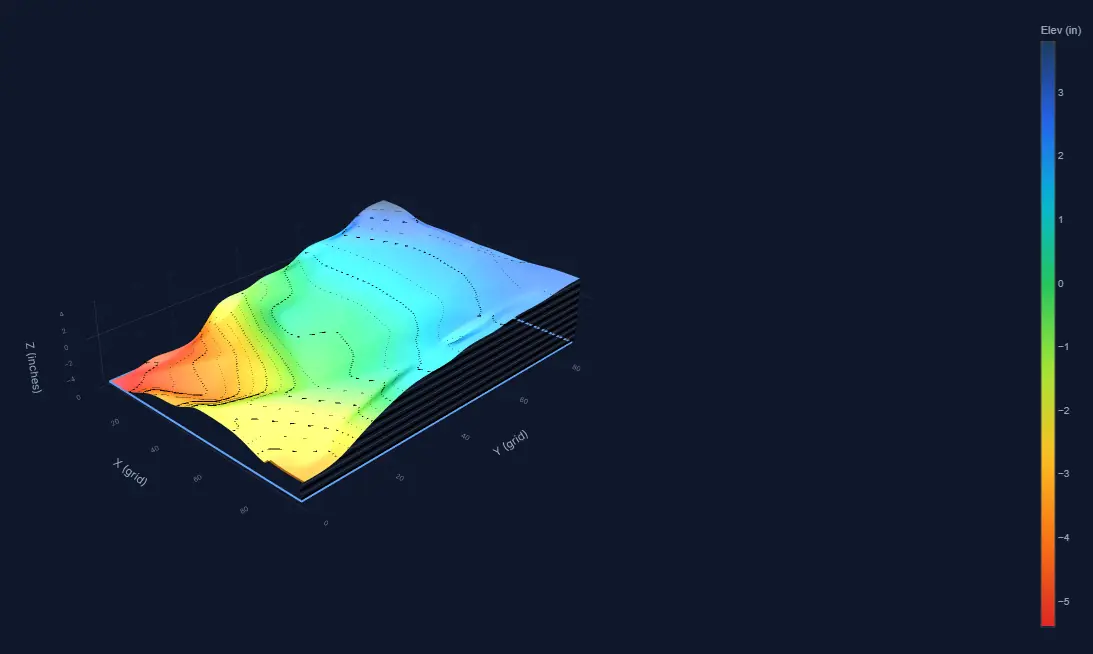
3D TOPO MODEL
See the slab in three dimensions
An interactive terrain model with draped contours and adjustable exaggeration — the fastest way to show a homeowner or an adjuster exactly what the foundation is doing.
- Interactive orbit and zoom
- Draped contour overlay
- Exaggeration control
AutoTranspose
Re-reference a survey — many reference points to one, or the reference relocated.
Report Builder
Compile every module into a branded, client-ready PDF.
Plan of Repair + Takeoffs
Lay out the repair on the drawing; piers, beams, and quantities take off automatically.
Estimate & Present
Price from your book, present a branded proposal, and capture the signature.
Invoicing & Payments
Send invoices and collect payment through Stripe — without leaving Meteora IQ. No commission and no payment markup, ever.
OPERATIONS
Past the proposal — run the whole job.
Winning the work is only half of it. The same platform that produced the bid now schedules the crews, routes the day, and tracks the profit — so the moment a job is signed it keeps moving, instead of falling off into spreadsheets and group texts.
SCHEDULING & ROUTING
Plan the day, not just the calendar.
Book every inspection and repair visit on one shared calendar, assign it to the right person, and give the customer a real two-hour arrival window instead of a vague “sometime Tuesday.” Once the day is set, a single tap orders each person’s stops into the shortest real-world route — using live Google Maps drive times and traffic, not straight-line guesses — so the crew spends the day on site, not in the truck.
- Two-hour arrival windows customers can plan around
- One-tap route optimization, per person, per day
- Real Google Maps drive times and live traffic
- Every address geocoded and mapped automatically
Smith Residence
1450 Oak St
Delgado Inspection
892 Cedar Ln
Harper Foundation
2201 Maple Ave
CREW DISPATCH
The office schedules. The field just shows up.
Keep every crew — employees and subcontractors alike — in one roster with their pay terms and contact details, then assign them to jobs and dates from a single board. Each crew lead sees exactly which jobs are theirs and when, so the daily hand-off stops living in group texts and whiteboards. Booking a crew and booking an inspection run on the same engine, so the whole operation reads from one schedule.
- One crew database for employees and subs
- Assign crews to jobs and dates from one board
- Every lead sees only their own run
- Pay method and cadence tracked per crew
Alpha Foundation Crew
Weekly · ACH
Rodriguez Concrete
Per job · Check
Lone Star Pier & Beam
Bi-weekly · Zelle
JOB COSTING
Know the profit while the job is still open.
Every job opens with a real budget, because its cost basis carries straight over from the estimate you already sold — material and labor, line by line, with subcontractor bids layered in wherever you have them. As the work runs, track cost against contract revenue and watch the margin move in real time. No export to a spreadsheet, no waiting for the books to close to learn which jobs actually made money.
- Cost basis pulled straight from the sold estimate
- Subcontractor bids captured per line item
- Committed and actual cost vs. contract revenue
- Live gross margin and profit on every job
THE DIFFERENCE
What you get that generic takeoff tools don't.
Tools like ArcSite draw, take off, and propose. Meteora IQ starts with the structural analysis they can't do — then carries the job all the way to paid.
Deflection & tilt analysis
Automated failure screening from measured floor elevations — scored against L/240–720 deflection and a 1% tilt limit, with the profile behind every verdict.
Elevation transposition
Re-reference a survey and map adjusted floor elevations directly onto the source drawing — many reference points to one, or the datum relocated.
Contours & 3D topo
Labeled elevation contours with a full high-to-low ramp, plus an interactive 3D surface model of the slab.
PE-sealed reports
Litigation-grade, standards-based reports your engineer can stamp — the seal stays entirely their call.
DEFENSIBILITY
Numbers you can stand behind.
Every figure on the report is auditable — traced to a real reading, tested against a real standard, and backed by the profile that produced it. Nothing to take on faith.
Traceable to the source
Every deflection and tilt figure links back to the exact elevation reading it came from. No black-box numbers.
Standards-based limits
Deflection is checked against your selected L/240–L/720 threshold and tilt against the 1% limit — the criteria a reviewer already expects.
The profile behind every call
Each flagged span shows the elevation profile that produced it, so any result can be hand-checked in seconds.
THE MATH
The math behind every number.
Meteora doesn't guess. Every result comes from the elevation data on your plan, run through the same surveying and structural-engineering math a professional would use by hand — just faster, and identically every time.
It starts with your data
You calibrate the plan to real-world scale and set a datum — a single reference point that reads 0.0. Every elevation on the drawing is read and measured relative to that point.
A continuous surface
From the individual readings, Meteora interpolates a continuous surface — estimating elevation between the measured points — then traces contour lines that connect points of equal height, exactly like a topographic map.
Deflection
Deflection is how far a point deviates from a straight reference line: a middle reading compared against the straight line between two endpoints. That is why a true reading needs at least three points — with only two there is a slope, but nothing to deflect from, so that case reports tilt only.
Tilt & slope
Tilt is the overall change across a span — rise over run — reported as a straightforward slope and, where useful, against the allowable-deflection ratios engineers already work to, such as L/360, L/240, or L/180.
The process is deterministic. The same plan with the same inputs always produces the same result — no randomness, no interpretation drift. Two people running the same file get the same answer, every time. The methods follow established principles for interpreting relative elevation change across a surface; Meteora's job is to apply them accurately and instantly, turning hours of manual takeoff into moments.
WHO IT'S FOR
Built for everyone who works on foundations.
Foundation contractors
Analyze, design the repair, take off, estimate, present, e-sign, and invoice — then schedule the crew and track the margin. Win the job and run it start to finish in one tool.
Learn moreEngineers
Standards-based, fully traceable analysis — plus repair design and estimating. Apply your own PE seal; the call stays yours.
Learn moreHome inspectors
Fast, defensible documentation of foundation condition — a professional add-on to every inspection.
Learn morePRICING
Pricing for every role.
Per-seat plans starting at $13.99/mo, with volume discounts as your team grows. Pick the path that fits — inspect, analyze, or run the whole job. Free 7-day trial, no card required.
0% commission on your invoices.
Invoice and collect through Stripe — Meteora IQ takes 0% of your invoices and never marks up your processing. You pay Stripe’s standard rate and nothing more to us, unlike platforms that skim a percentage of every payment you collect.
Inspect & report
Sitemap, elevation transposition, contours, 3D topo, and branded reports.
from $74.99/seat
Analyze & engineer
Automated deflection & tilt analysis, with the PE stamp built into every Engineer plan.
from $129.99/seat
Design, bid & close
Plan of repair with takeoffs, estimates, present & e-sign, and invoicing.
from $99/seat
All plans are priced per seat with volume discounts, billed monthly or annually (two months free). Multiple seats for your organization? Email meteora@meteoraiq.com
QUESTIONS
Answers before you ask.
FREE 7-DAY TRIAL
Run your next survey through it
No credit card. Upload a sitemap and see the full analysis in minutes.